Does the Gross Domestic Product affect the suicide rate?
Does the Gross Domestic Product affect the suicide rate?
Hypothesis: The Gross Domestic Product (GDP) is one of the factors that contributes to the increase in the suicidal rate.
Suicide is a very complex issue all over the world that affects many people every year. It is one of the major causes of death of the young people. The data also predicts that every 40 seconds a person dies from suicide. The main goal of this document is to find the relation between the total GDP by country and the suicide death rates by country. To carry out the following hypothesis, we have selected 2 datasets:
· suicide-death-rates.csv
· gdp.json
Both of the datasets were taken from an online website ourworldindata.org and to be specific the links to the datasets are https://ourworldindata.org/suicide#suicide-is-a-leading-cause-of-death-especially-in-young-people and https://ourworldindata.org/economic-growth .
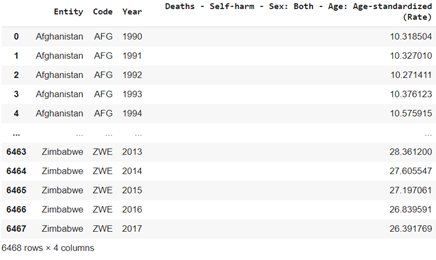
We can have a glance at the data the data set contains using basic pandas and python. The suicide-death-rates.csv contains about 6469 records which is decent enough to extract the information.
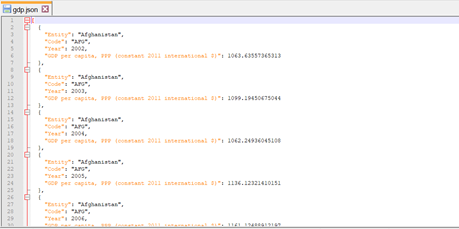
Similarly, the gdp.json file also can be viewed as a dataframe in python but instead we view it in the json format.

Data Cleaning
It is very important that we must know the data that we are working with. While importing the datasets in Oracle or any other database management systems, the numerical data will be loaded as VARCHAR, that makes statistical analysis very difficult. Since we are working with pre-processed analyzed data there was not much cleaning required. Further information regarding data cleaning can be seen in the appendix section.
We can have a look at the missing values from our dataset.

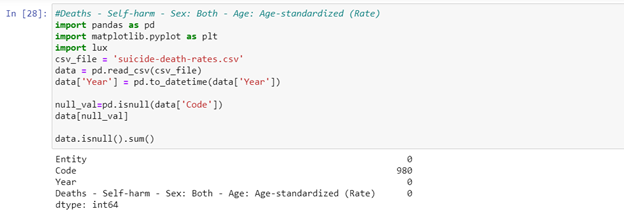
We can see that there are 980 missing values for Code column. Since, Code is just the abbreviation of the column Entity, we can use the dataset without cleaning the missing values.
Query in SQL Developer
To process large datasets and extract valuable information SQL consists of OLAP queries. OLAP stands for Online Analytical Processing. It is one of the advantages of the SQL databases as OLAP is not supported in NoSQL databases. In the present context, we will be using ROLLUP and CUBE.
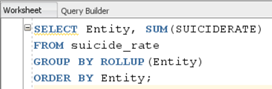
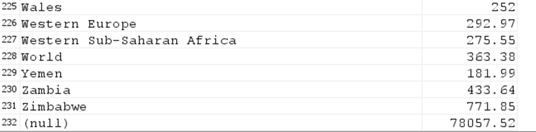
Let us use a ROLLUP query in SQL to calculate the total sum of the suicide rate for each country and the total sum of all countries.


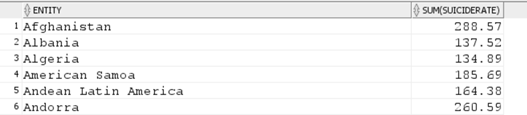

Similarly, we can also depict similar information using the CUBE query.

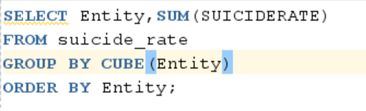

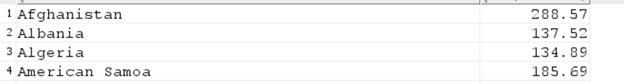

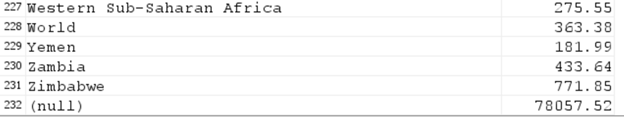
We can see that both results seem similar. The only difference between ROLLUP and CUBE is that ROLLUP generates aggregate values for all selected columns whereas CUBE aggregates all the possible combinations.
Visualizing the two datasets
To verify and support our hypothesis, we tried to visualize the datasets using the python programming language. The collection of the used datasets along with the visualizations in python is uploaded in the link https://github.com/sandesh8888/suicidevsgdp and anyone with interest can have a peek at it.
Time Series visualization
World Suicide Rate vs Year


World GDP vs Year


The visualization is aimed at discovering the suicide vs gdp trend in all countries along with the trend in the world data. To extract the useful information, a scatter plot was drawn for GDP against the suicide rate for the world data which displayed:

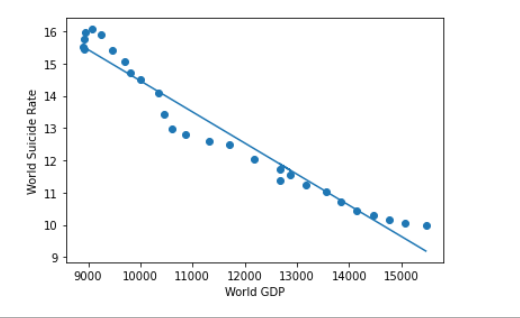
As you can see, we wanted to find the relation of the suicide rate with respect to the gdp rate. From the plot we can clearly see that there is the negative linear relation between the two data. It suggests that the suicide rate decreases if the gdp rate increases and vice versa.
Thanks Mr. Data with Sandesh. I am a CS student currently studying data analysis in my last year. I have the same assignment that includes data analysis to find correlation between GDP and suicide. With your suggested steps now I can work on my assignments at any time. Thanks a lot sir.
ReplyDelete