Excel for Data Analysis (Beginners Edition)
Excel for Data Analysis (Beginners Edition)

Many people recognize Microsoft Excel as a tool designed to create spreadsheets and use it as a database for a small-scale business. But there are a plethora of users without a clue that Excel is one of the great tool for Data Analysis.
Apart from storing and manipulating data, excel provides many other important features that are very useful in analyzing data and extracting a conclusive decision. For example, Pivot table is one of the best feature that a user can use in order to analyze or group large sets of data. Also, sorting can be done in excel and it is best suitable for smaller sets of data.
Never heard of Pivot Tables? Don’t worry this blog is all about getting started with Pivot tables.
Pivot Tables
Pivot table is a great and essential tool in Excel that helps summarize and analyze large datasets. For example, pivot table allows user to extract, group and analyze data similar to any other SQL queries but here user does not need to actually query the results. Did not catch it? Let’s look at an example starting from the creation of the pivot table.
- Creation of the Pivot table
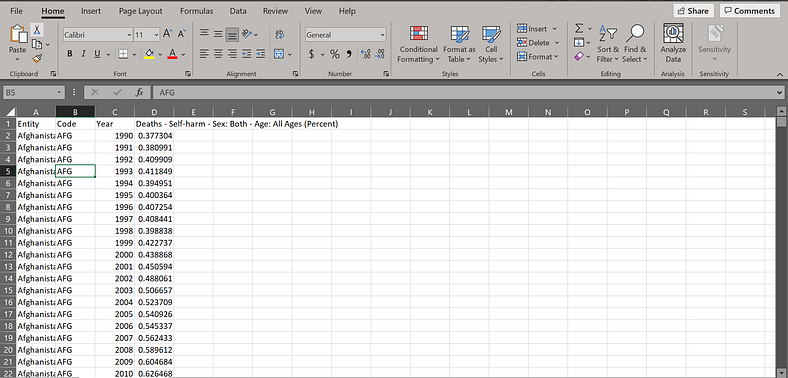
The first and foremost thing prior to creation of pivot is that your dataset must be cleaned. The Dirty Data can lead to unreliable and inaccurate results. Below is the preview of a clean dataset used to create pivot.

Now let us create a pivot table. Go to Insert tab and click on PivotTable as marked in the figure below.

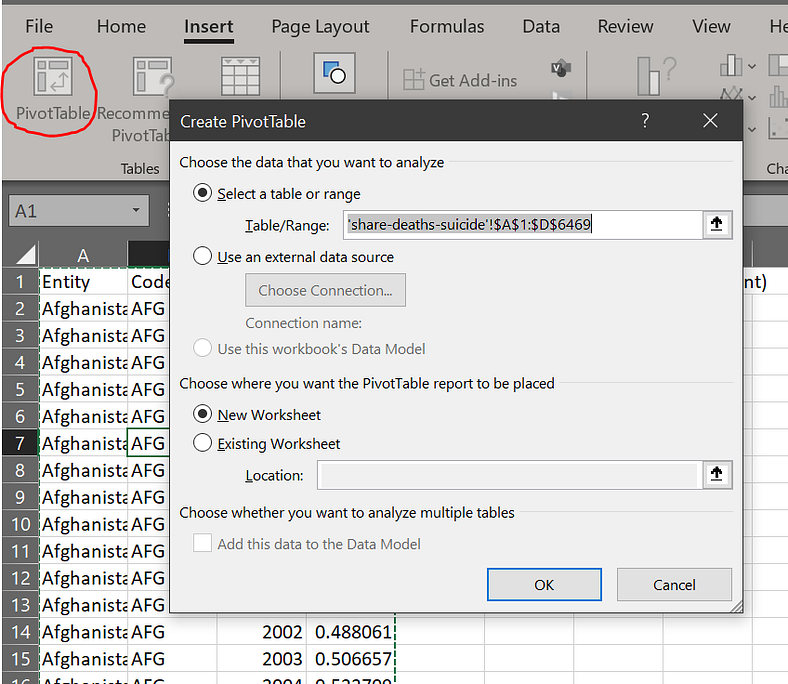
Click OK and you will see a new empty worksheet.

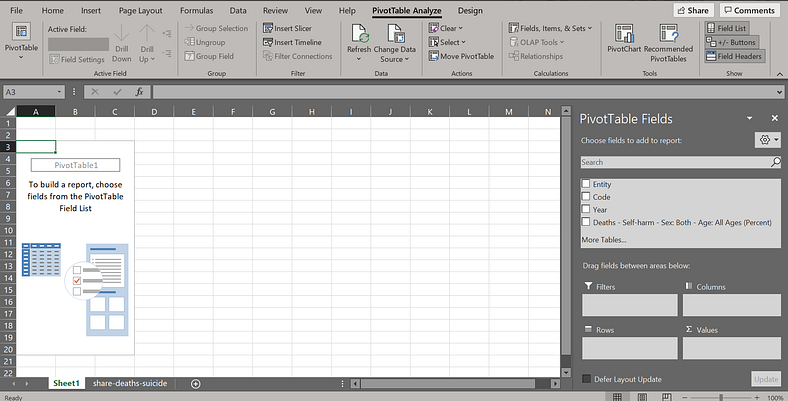
2. PivotTable Fields
The pivot table fields are the entities in the right section. The right section contains field lists, filters, columns, rows and values. A field lists consists every fields or variables or the column headers included in the pivot. Filters are the fields that can be used as a filter to extract only some data. Columns field includes the layout of the pivot. Similarly, Rows include variables row-wise in the pivot. Values includes the quantitative measures or the numerical variables.
Let us now play with the PivotTable layout and try to assign variables in the fields. In the below example, we have one numerical value i.e. death-rates; therefore, it fits in the value field. We have many rows in the original dataset therefore, it is better to list our pivot row-wise instead of column-wise. We have added Year column in the row field and Entity column in the filter field so that we can search the data by country. As you can see in the figure below only the data for Nepal is displayed.

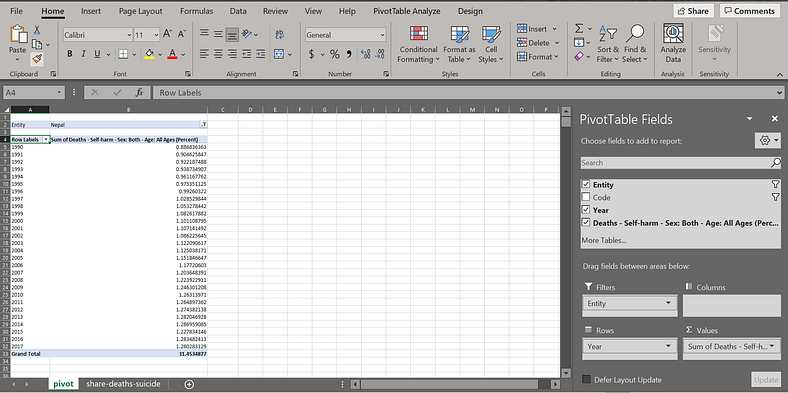
There it is you first Pivot Table. You should always play and know your stuffs. This is only the basic tutorial to create a pivot table and do not forget there is a lot more to come.
Comments
Post a Comment